
GTmetrix

درباره سایت
آخرین مطالب
- Recent GTmetrix updates and fixes
- Compare page and Dashboard filter updates
- Moving from Legacy GTmetrix Report to the new GTmetrix Report
- Recommendation Updates – HTTP/2 changes and more
- GTmetrix interview with Website Planet
- More Waterfall Updates and Browser Upgrades
- Catena Media: An Integrated Workflow Case Study
- GTmetrix 2019 Black Friday/Cyber Monday Deal
- Compare with Analysis Options, Fullscreen for Waterfall Charts and More Updates
- How to Analyze a Waterfall Chart
امکانات وب
Welcome to GTmetrix PRO!
As a PRO user, you have access to more performance insights and reporting to help keep your site optimized and ruing smoothly.
In this guide, we’ll show you how to get started with your PRO plan and set up your performance analysis like, well…a pro!
If you haven’t gotten acquainted with the Basics of GTmetrix, read this article first: Getting Started with GTmetrix.
Key PRO Features
You get some pretty nifty functionality with GTmetrix PRO – The key differences relate mostly to monitoring/API usage and premium Analysis Options. We detail them below:
1) More monitored/saved slots and API credits
You can naturally monitor and save more pages with your PRO plan.
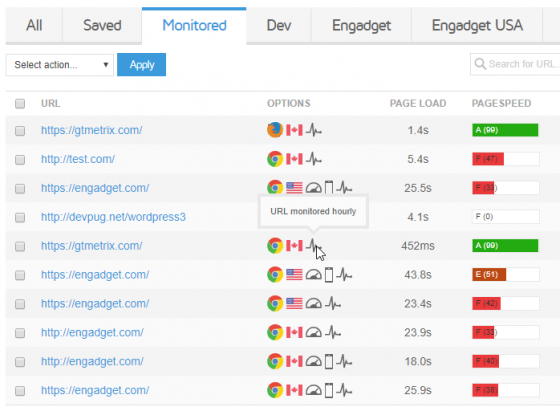
You can monitor a lot more pages now!
We recommend monitoring your pages in different devices, coection speeds and regions for a more complete view of your page performance. Read more on Why you should monitor your page for performance.
If you have a series of reports you wish to keep a record of, you can Save the page. Saved pages are excluded in our ongoing data purges, so be sure to enable them for important pages.
Note that monitored pages are exempt from the aforementioned data purge.
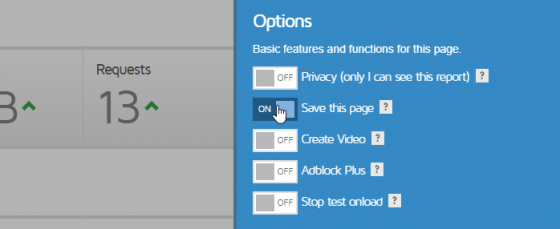
Enable “Save this page” in the Page Settings.
Lastly, if you use the API, you may have more credits to perform GTmetrix tests with, and access to Developer Toolkit options like Simulated Devices.
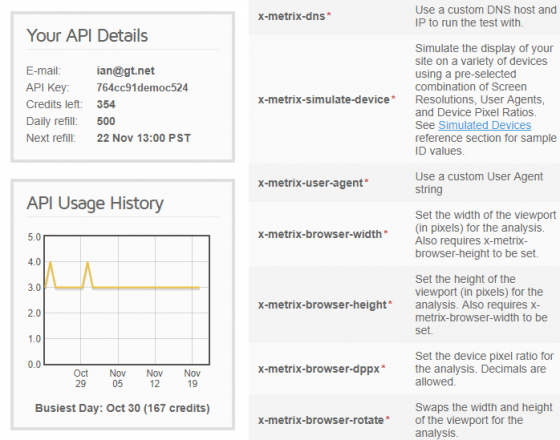
GTmetrix API credit usage and parameters available on the API page.
You can find these details in the GTmetrix API page.
2) Hourly monitoring
Hourly monitoring helps you see how your site performs throughout the day. All PRO plans and select Custom plans have access to hourly testing in the Monitor frequency dropdown.
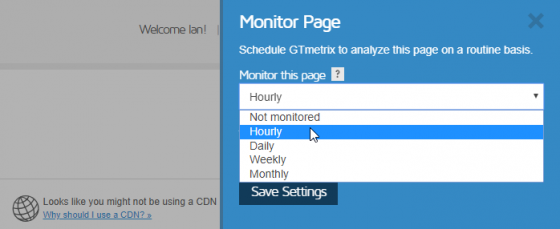
Select Hourly monitoring for more fine grain report data.
Be sure to combine monitoring with Alerts to get notified if/when you’re experiencing performance issues.
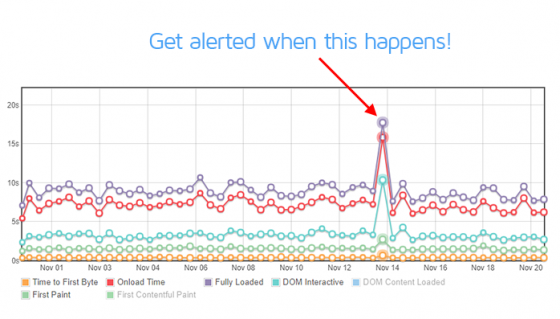
Hourly monitoring with alerts can help catch issues on your site.
3) Monitoring in different regions
You can monitor your page in various regions to ensure your page loads well for all your visitors worldwide.
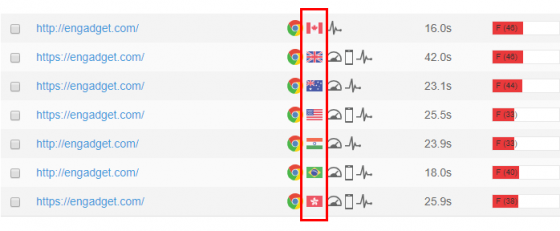
Monitor in all of our 7 test regions around the world.
Look at your logs/analytics to see where most of your visitors are coming from, then select the closest test region to monitor.
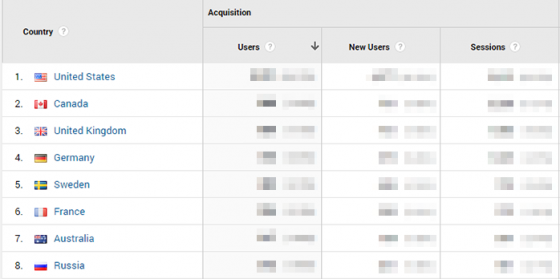
Your analytics should show basic segmentation of your visitors.
4) Simulated Devices (via Developer Toolkit)
PRO and select Custom plans have access to the Developer Toolkit, located in the Analysis Options on the Dashboard.
Access the Developer Toolkit in the Analysis Options menu.
A defining feature is our Simulated Device feature, which lets you see how your page loads on popular mobile devices.

Test your page in different simulated devices.
You can simulate your page load on over 20 different device models and variants and apply Analysis Options to fit your testing scenarios. Read more on How to Simulate Devices with GTmetrix.
Other PRO features
More features are available with PRO that can help you get a better handle of your page performance.
Note that some features are only available in select PRO plans.
Priority access for tests
PRO users get priority access in the queue for their tests.
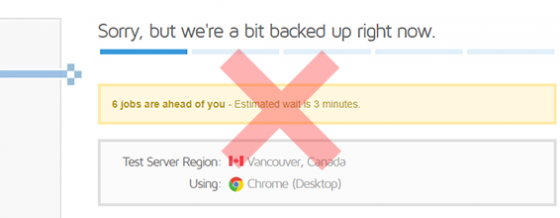
Wait no more with GTmetrix PRO!
This means you wait less during peak usage periods and your reports generate faster than Guest or Basic/Free users.
Dashboard Filters
You can create unlimited Dashboard filters to help organize your pages and reports.
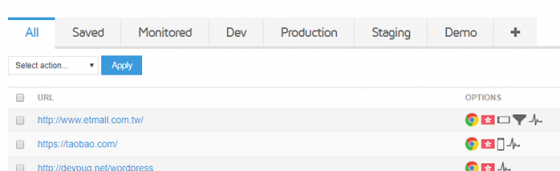
Create filters to help you find relevant pages and reports.
For a complete guide on our Dashboard, have a look at our Dashboard Tips and Tricks article.
Video Alerts
With Video Alerts, you can save video playback of your page when an alert is triggered.
Playback your page’s load behaviour when you’ve triggered an alert.
See exactly how your page behaved after an alert and get more insight on user experiences.
Developer Toolkit
We mentioned Simulated Devices above, but there are a lot more features available in our Developer Toolkit.
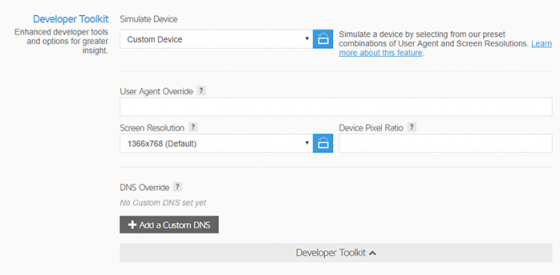
The Developer Toolkit is available in Bronze, Silver, Gold plans and as an add-on for Custom plans.
We break down our main Developer Toolkit features here:
Read more about the Developer Toolkit release here.
White-labelled PDFs (Select plans only)
GTmetrix PRO Gold and select Custom plan users can brand their PDF reports with a logo and company description.
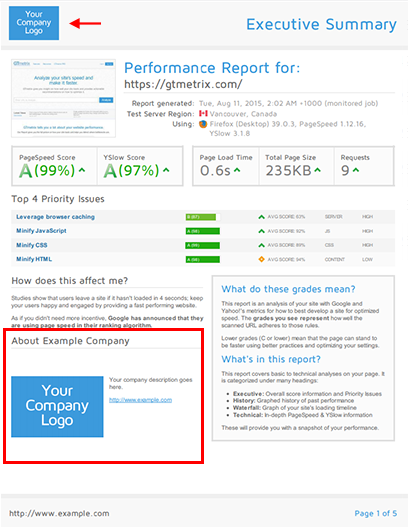
Upload your own logos on GTmetrix PDF reports with White-labelling.
In your User Settings or PRO page, you’ll see a “Branded PDF Settings” option in the “Your PRO Settings” box.
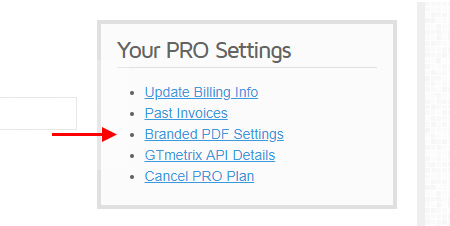
“Branded PDF Settings” are located in the User Settings page.
Clicking it with expand a sidebar with all of your Branded PDF options.
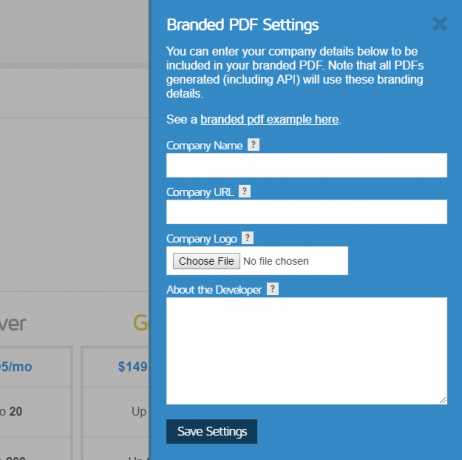
Upload your own logo and enter your own description.
All PDFs generated – including ones from the API – will use your custom logo and descriptions.
Managing your PRO plan
All of your PRO plan details and options are available for management from the User Settings or PRO page under the “Your PRO Settings” box.
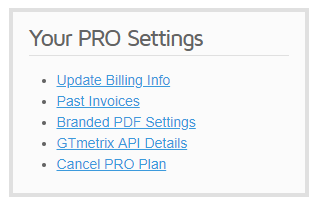
Access Your PRO settings on the GTmetrix PRO page or User Settings.
You can view and manage details such as:
- Billing Info
Change credit card details, billing addresses and contacts, etc.
- Past Invoices
Click on “Past Invoices” – a menu will slide out with a drop-down listing all of your previous invoices.
- Branded PDF Settings
Gold and Select PRO plans only. See above for details on how to set up a Branded PDF with GTmetrix PRO
- GTmetrix API Details
See your API usage details as well as Developer Toolkit parameters on the API page.
- PRO Plan Cancellation
Cancel your PRO plan at any time (though we hope you won’t!).
Of course, if you need any assistance regarding your PRO plan, please feel free to contact us!
PRO Support
As a GTmetrix PRO subscriber, we welcome you to reach out to us for support or assistance. Here are a few things we can help out with:
- Bulk URL upload
- Change http:// URLs to https://
- PO or manual invoice billing terms
- Custom reporting or API integration requirements
- … let us know what you need!
We’re eager to provide guidance with anything else you might need, so drop us a message and let’s talk!
برچسب:
نویسنده: وستا