
GTmetrix

درباره سایت
آخرین مطالب
- Recent GTmetrix updates and fixes
- Compare page and Dashboard filter updates
- Moving from Legacy GTmetrix Report to the new GTmetrix Report
- Recommendation Updates – HTTP/2 changes and more
- GTmetrix interview with Website Planet
- More Waterfall Updates and Browser Upgrades
- Catena Media: An Integrated Workflow Case Study
- GTmetrix 2019 Black Friday/Cyber Monday Deal
- Compare with Analysis Options, Fullscreen for Waterfall Charts and More Updates
- How to Analyze a Waterfall Chart
امکانات وب
Having trouble understanding the new GTmetrix Report? Here’s some help to transition from our Legacy Reports to the new GTmetrix Report.
Overview
The new GTmetrix Report represents an all-new performance benchmark for your webpage.
It tracks a different set of Performance metrics and contains new recommendations (called audits) by way of the Structure Tab compared to prior reports.
We’ve written this blog article to help ease the transition from the Legacy GTmetrix Report to the new GTmetrix Report.
For each section of the report we’re covering in this blog article, we’ve highlighted key aspects related to report analysis and then show you how they are mapped in both the Legacy Report and the new GTmetrix Report.
First Glance/Summary
When you open a GTmetrix Report, whether Legacy or new, the first thing you’d notice is the information presented front and centre, which gives you a snapshot of your webpage’s performance results.
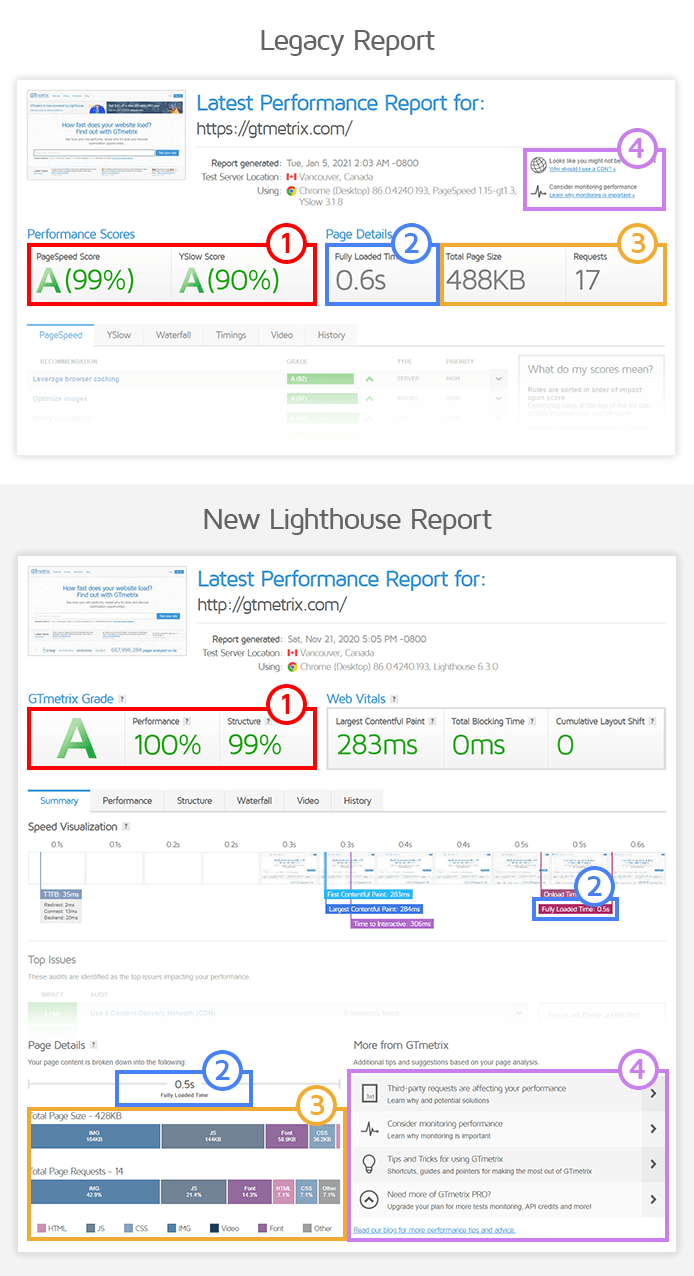
Legacy vs New Report: Key Details. Click image to open in a new tab.
There are 4 key things you’ll be looking at here, which are listed below:
1) Grades and Scores
Legacy Reports show your PageSpeed and YSlow scores, which reflected how well your page adhered to Google’s and Yahoo’s web performance best-practices.
PageSpeed and YSlow scores served us well in the past; however, they are now considered outdated and do not paint a modern picture of performance.
New Reports no longer display PageSpeed/YSlow scores, and are replaced with the GTmetrix Grade, Performance and Structure Scores, powered by Lighthouse – the new standard of web performance metrics.
- Your Performance Score tells you how well your page actually performed in terms of visual loading, interactivity, and visual stability.
- Your Structure Score tells you how well your page adheres to Google’s latest best-practices in the field of web performance (comparable to PageSpeed/YSlow scores).
- Your GTmetrix Grade blends your Performance and Structure Scores into a single grade that reflects your webpage’s overall performance.
Besides the above, you’ll also find the Web Vitals in the new GTmetrix Report right next to your page scores, given how much importance Google has placed on Web Vitals for web performance and search engine rankings.
2) Fully Loaded Time
Fully Loaded Time tells you how long your page took to completely load.
In the Legacy Report, you’ll find it right next to your page scores.
In the new GTmetrix Report, you can find this timing in two places on the Summary Tab:
- In the Speed Visualization timeline showing the point at which your page meets the “Fully Loaded” condition.
- At the bottom of the Summary Tab in the Page Details Section.
Note that Fully Loaded conditions differ in the Legacy and New Reports.
Read more on the conditions here.
3) Total Page Size and Requests
These details give you a high-level overview of your page’s payload and network requests.
In the Legacy Report, you’ll find this next to your Fully Loaded Time.
In the new GTmetrix Report, you will find this information in the Page Details Section, which is located in the bottom left corner of the Summary Tab.
The new GTmetrix Report also breaks down your page content by type (e.g., images, CSS, JavaScript, etc.), and hovering over each segment allows you to determine at-a-glance if your page is heavy on images, JavaScript, etc.
4) More from GTmetrix
This section gives you relevant tips related to your page’s performance (e.g., Slow server response, lack of CDN usage, etc.).
In the Legacy Report, you’ll find this section near the top of your report, next to the Analysis Options for that particular report.
In the new GTmetrix Report, this section can be found in the bottom right corner of the Summary Tab.
Timings/Performance Metrics
After an initial look at your overall page results, you can investigate more details related to your webpage’s performance by looking at timings.
In the Legacy GTmetrix Report, you’ll find such timings in the Timings tab.
In the new GTmetrix Report, you’ll find them under Browser Timings in the Performance Tab.
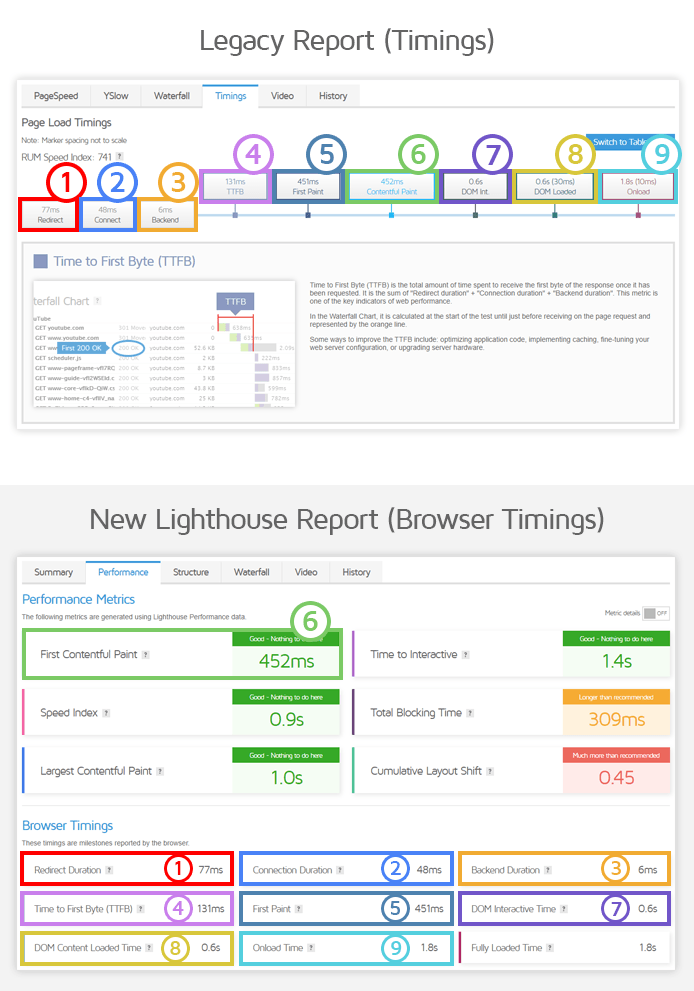
Legacy Timings have been moved to the Performance Tab. Click image to open in a new tab.
All timings are available in both Legacy and New Reports, just in different locations.
Note that the Browser Timings have no impact on your Performance Score, but are still listed in the Performance Tab as they may be useful for further analysis by experienced developers.
New GTmetrix Reports have more modern timings
While Browser Timings can be useful, they alone do not provide a user-centric perspective of your page performance.
The more modern, Lighthouse-based timings, are only available in the new GTmetrix Reports.
The first ones you’ll see at the top are the 6 Performance metrics that directly determine your page’s Performance Score (located in the Performance Tab).
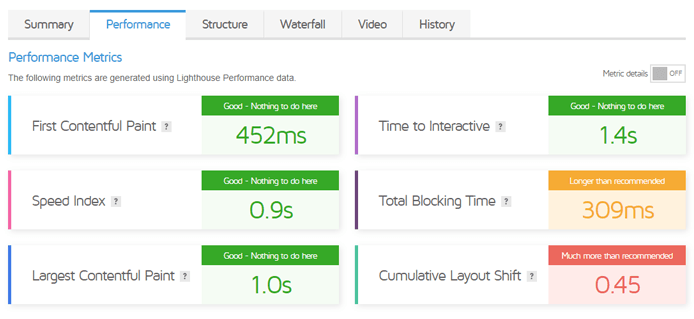
The 6 key Performance metrics that make up your Performance Score.
Among these timings are the Web Vitals – 3 key metrics that are most impactful to the perception of performance:
Web Vitals are also important as they are signals used by Google to determine search ranking, and should be seriously considered in your performance optimization efforts.
Recommendations vs Audits
The core basis of GTmetrix Legacy Reports were the older PageSpeed/YSlow Recommendations, which only assessed how your page’s front-end structure was built. These were defined by best-practices established by Google and Yahoo some years ago.
These Recommendations have been succeeded in the new GTmetrix Report in the form of Lighthouse audits, which are essentially the evolution of these recommendations and best-practices, and are listed on the Structure Tab.
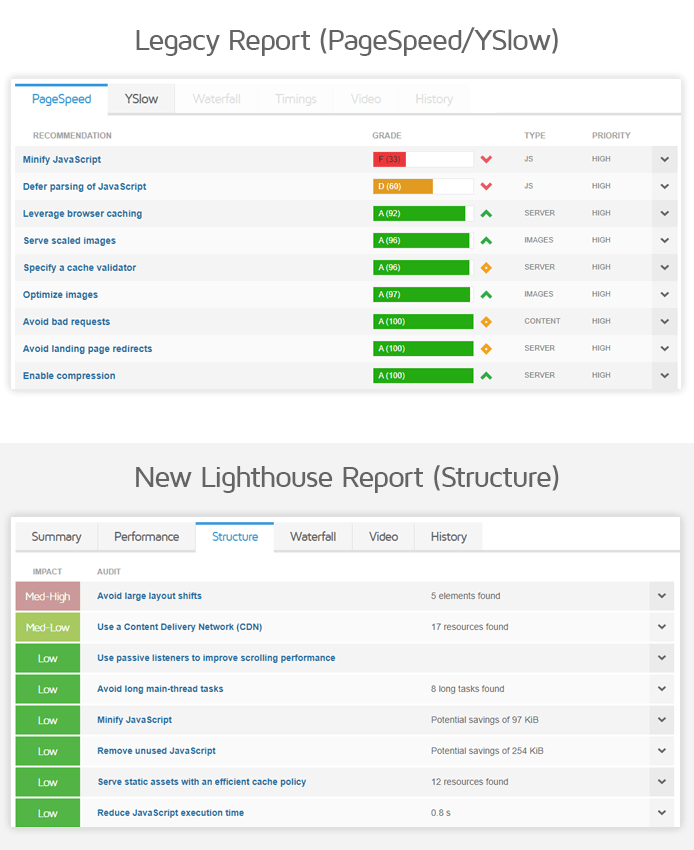
PageSpeed and YSlow Recommendations have now evolved to Audits located in the Structure Tab of new GTmetrix Reports.
As always, you can click on individual audits to find more details regarding the resource(s) that contributed to the audit’s impact:
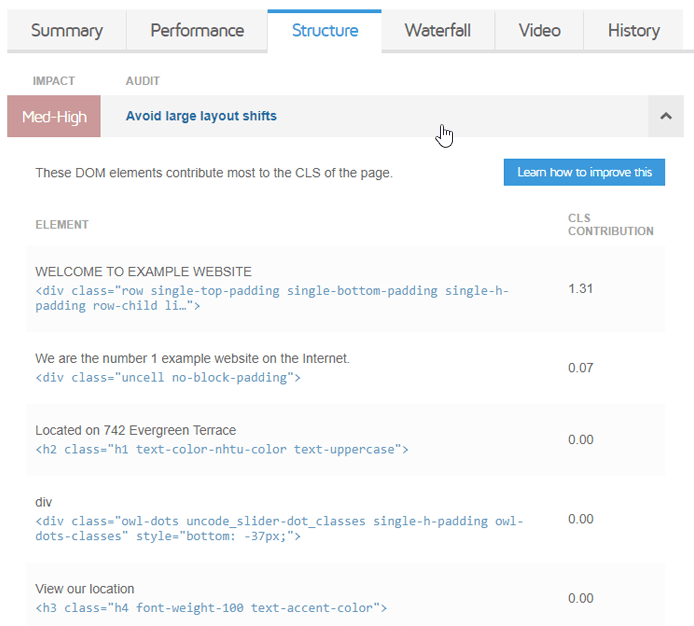
Clicking on the Audit reveals more details on what resources contributed to the audit’s impact score.
You can also find the top 5 impacting Structure audits in the Summary Tab under Top Issues:
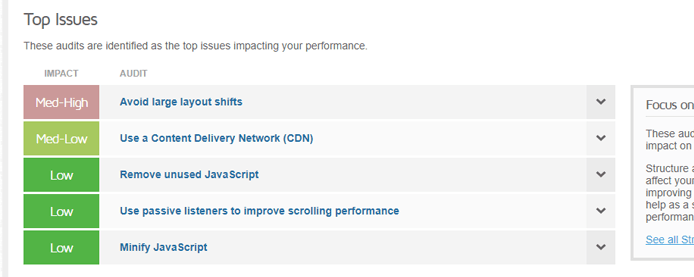
New GTmetrix Reports show the Top 5 Structure Audits affecting your page performance.
As you improve each audit, this section gets updated with the next 5 audits that have the highest impact on your page’s performance at the time of the test.
Comparing PageSpeed/YSlow Recommendations to Lighthouse Audits
While some of the Legacy Report Recommendations are deprecated (i.e., they are no longer considered important or necessary for modern websites), some of these audits are similar to prior PageSpeed/YSlow Recommendations, are evolutions of the Recommendation, or entirely new.
For easy reference, we’ve created a table below to map the old PageSpeed/YSlow Recommendations that have been carried over to the new GTmetrix Report.
* This is a GTmetrix Custom Lighthouse audit. Read more about them here.
Changes to specific Recommendations/Audits
While some Legacy Recommendations differ from Lighthouse audits in name and/or minor definitions only, there are a few popular Recommendations we should highlight, which saw changes in functionality in-line with updated web development practices.
Serve scaled images is now Properly size images
The Served scaled images recommendation found under the PageSpeed tab in Legacy Reports is now the Properly size images audit in the new GTmetrix Report.
Properly sizing images on your page is a web performance best-practice that should be incorporated into your development workflow (e.g., through srcset).
Consequently, this audit instead focuses on the total potential savings in terms of image file size, rather than the image dimensions.
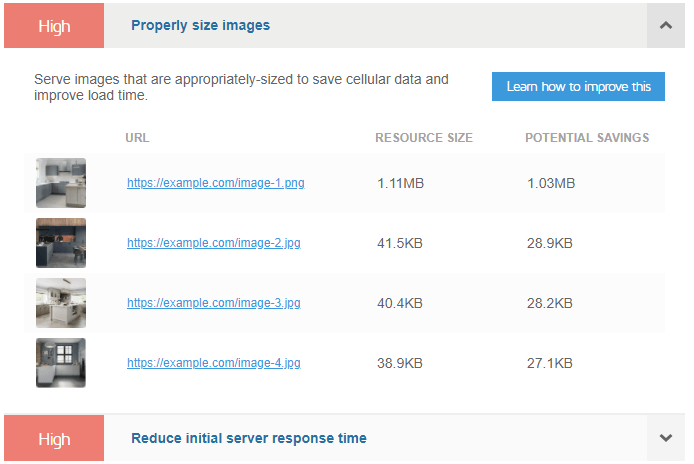
The Serve scaled images recommendation in Legacy Reports is now the Properly size images audit in new GTmetrix Reports.
Learn more about this audit here.
Note that the original Serve scaled images recommendation in Legacy Reports still reports the original and resized image dimensions.
Optimize images is now Efficiently encode images
The Optimize images recommendation found under the PageSpeed tab in Legacy Reports is now the Efficiently encode images in the new GTmetrix Report.
Besides the change in name, there is no other change in functionality here, and you can obtain the optimized versions of the image by expanding this audit in your GTmetrix Report and clicking on the “Optimized Version” link to view/save an optimized version of your image.
Note that you must be logged in to download the optimized version.
Optimized images may also be expired (we only keep extra report data for 24 hours), and must be regenerated with a Re-Test.
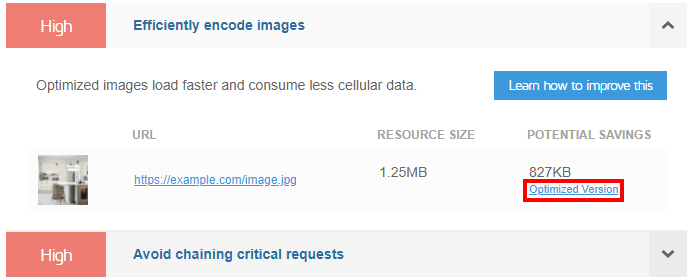
In the new GTmetrix Report, optimized/compressed images can be found by expanding the ‘Efficiently encode images’ audit and clicking “Optimized Version.”
Learn more about this audit here.
Summary
Our move to Lighthouse metrics represents a necessary shift in performance testing methodology.
At first glance, navigating from our Legacy Reports to our New Reports seems like an intimidating task indeed.
However, if you look closely, you’ll see that – apart from the new Lighthouse metrics – many of the changes made are akin to minor facelifts and reorganizations of content.
We hope this article can help you ascertain the differences in finding information related to your webpage’s performance from the Legacy Reports you’ve grown used to over the years.
Learn more about the new GTmetrix Report
For more details on our new Lighthouse-powered report, you can read our article: Everything you need to know about the new GTmetrix Report.
Keep your site’s performance at the top of your mind
PRO Monitoring Splash
Get more On-Demand Tests, Monitored Slots and Premium Test Locations along with Hourly testing with a GTmetrix PRO plan.
Other features include: Priority queue access, Mobile Testing, Remote Location Monitoring (including Premium Locations), and more.
Upgrade to PRO today!
برچسب:
نویسنده: وستا