- Recent GTmetrix updates and fixes
- Compare page and Dashboard filter updates
- Moving from Legacy GTmetrix Report to the new GTmetrix Report
- Recommendation Updates – HTTP/2 changes and more
- GTmetrix interview with Website Planet
- More Waterfall Updates and Browser Upgrades
- Catena Media: An Integrated Workflow Case Study
- GTmetrix 2019 Black Friday/Cyber Monday Deal
- Compare with Analysis Options, Fullscreen for Waterfall Charts and More Updates
- How to Analyze a Waterfall Chart

آخرین مطالب
امکانات وب
A collection of useful tidbits to make GTmetrix a little more convenient and/or useful.
A handy guide for all things Dashboard
The GTmetrix Dashboard is the center of all your analysis activity.
You can select desired Analysis Options and initiate new tests. All of your tests are shown in a table, with a summary of details displayed for at-a-glance reading.
There are 3 main sections on the GTmetrix Dashboard: 1) Analyze and Analysis Options, 2) Report Table, 3) GTmetrix Usage and News/Updates.
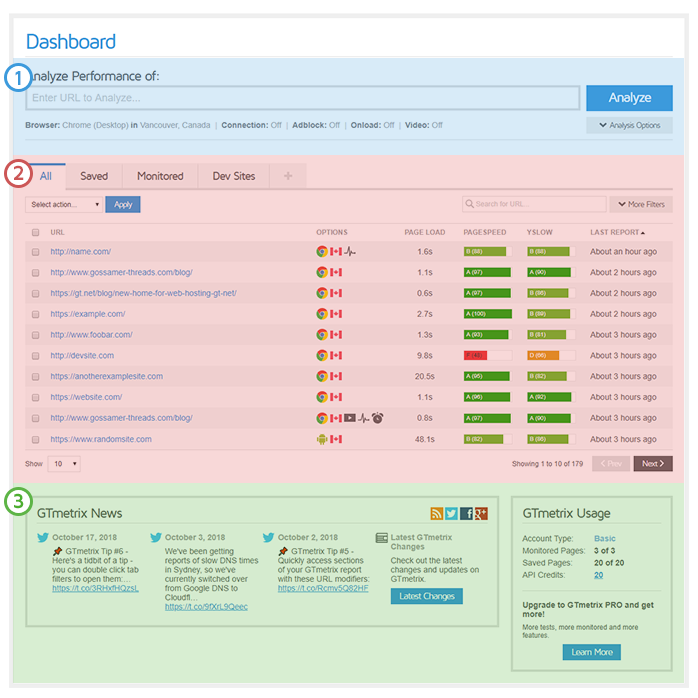
GTmetrix Dashboard split into 3 sections: 1) Analyze and Analysis Options, 2) Report Table, 3) GTmetrix Usage and News/Updates.
In this guide, we’ll break everything down about the Dashboard so you can make the most of it.
1) Analyze and Analysis Options
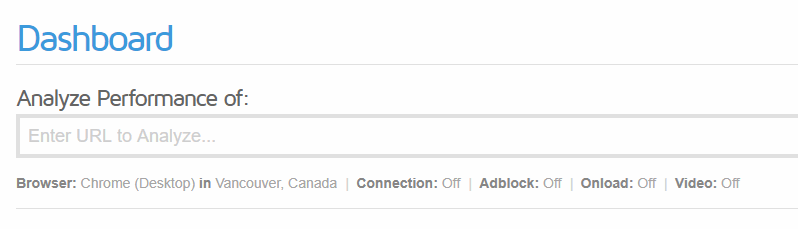
Here’s where you get started with your optimization journey. You can enter new URLs here for analysis, and select desired Analysis Options for a variety of test scenarios.
Click “Analysis Options” to reveal additional test features.
We’ve covered the basics of GTmetrix analysis in our Basic Analysis with GTmetrix article, so be sure to take a look.
Quick Tip: Change Analysis Options with one click
Click on status line options to quickly change options
On the Dashboard, you can click on options on the status line to quickly cycle through them instead of having to expand the Analysis Options.
PRO Tip: Analysis Presets
With GTmetrix PRO and the Developer Toolkit, you can create presets of your Analysis Options for quick and convenient testing.
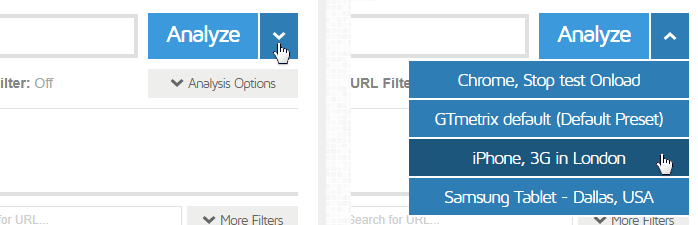
Dashboard Analyze Button now has a dropdown for presets.
Read more about setting up your own presets here: How to use Presets with GTmetrix
2) Report Table
After successful analysis, this is where all of your GTmetrix reports appear, in order of last report generated.
New entries will appear in the report table below if:
- The page analyzed is new and hasn’t been analyzed before, or
- The page has different options than the ones analyzed before.
Entries in the report table show the latest report of the page analyzed.
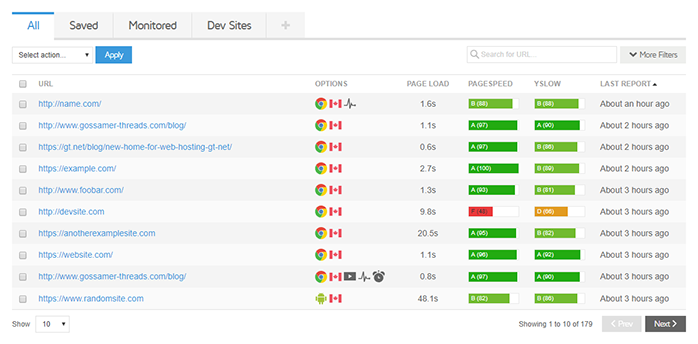
All tests initiated from the Dashboard and API appear in the Report Table.
Here are a few quick tips to help navigate through your reports easier:
Report Filtering
The best way to find and categorize your reports is by using the filtering options. You can do a quick filter by keyword using the field in the top right.
Quickly filter out domains with keywords – “dev” in this example above.
You can also do more advanced filtering by clicking More Filters and selecting the additional options you wish to filter your reports by.
You can also sort by multiple filters.
Pick the test region, monitoring status, browser and any other Analysis Options to easily find the reports you’re looking for.
Save Report Filters into their own tabs
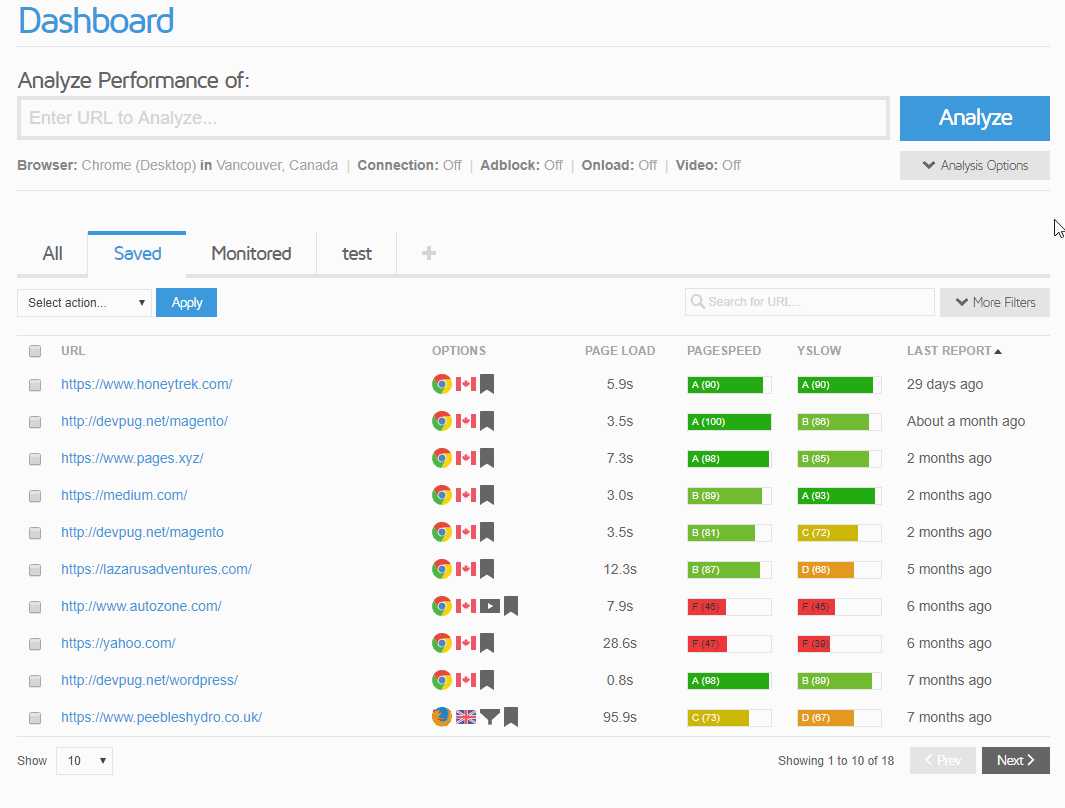
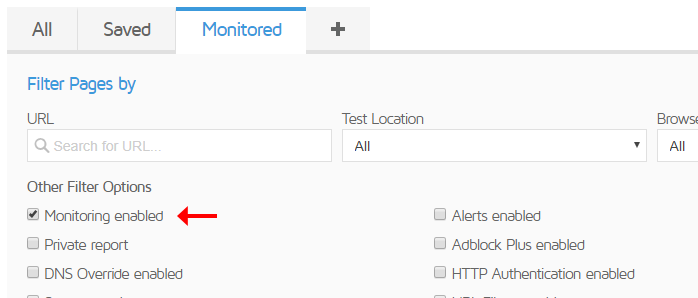
You’ll initially see 3 default filters set for you on your report table: All, Saved and Monitoring.
Naturally, the Saved and Monitoring filters will show you which pages are Saved and Monitored respectively. You can edit or delete these two filters as you please.
Saved and monitored tabs are editable and/or deletable!
If you’ve created a filter that delivers your desired reports, you can save it as a tab for convenient access.
After selecting your filters, click Save As on the bottom right corner. A Filter Name field will appear where you can rename the tab.
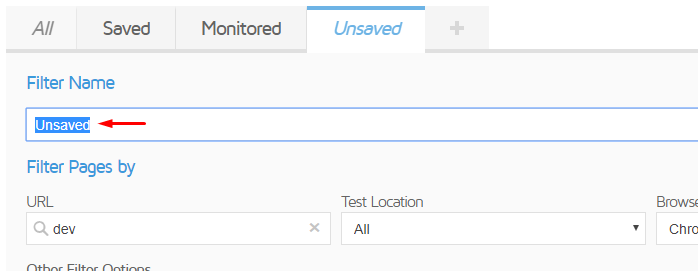
Rename your filter tab to something useful.
Click Save when you’re done and your tab will appear on your Dashboard. You can have up to three filter tabs on a Basic plan. Upgrade to PRO for unlimited filters.
Hover over Analysis Option icons for more details
You can hover over the icons in the Options column for more details.
Hover for more details!
Click on columns headers to reorder reports
You can click on the URL, Page Load, PageSpeed, YSlow and/or Last Report columns to sort reports by ascending or descending order.
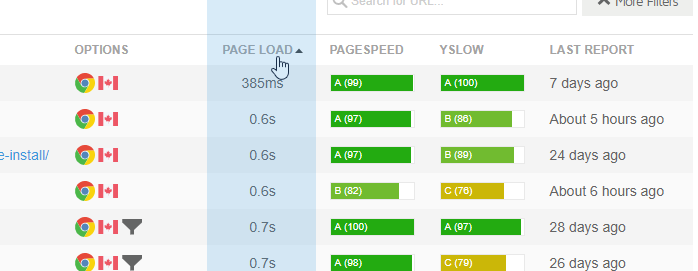
Re-sort rows by URL, Page Load Time, PageSpeed or YSlow Scores and Latest Report.
Use this to find the pages with the slowest Page Load, or worst PageSpeed/YSlow scores, or to sort by name/last report date to find desired reports.
Show more reports in the Report Table
You can show up to 100 reports on the Dashboard. Just select the amount you wish to view in the bottom left “Show” dropdown.
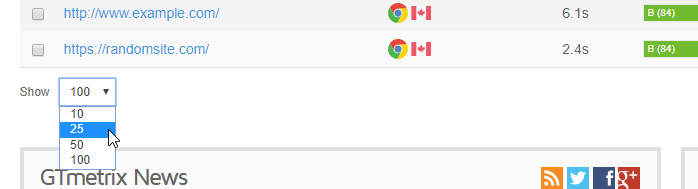
Show up to 100 reports on your Dashboard.
Bulk delete pages or compare reports
You can perform bulk actions with You can delete multiple pages by checking off the desired pages, selecting an action from the top left dropdown, and clicking “Apply.”
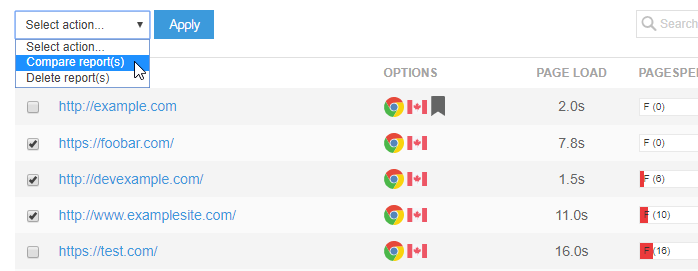
Perform bulk actions on the Dashboard.
Report comparisons will use the latest reports generated from that page. Up to four reports can be compared.
3) GTmetrix Usage and News/Updates
At the bottom you’ll see a feed for our GTmetrix Twitter account for news and updates – pretty standard really.
You’ll also see your GTmetrix Usage, with amount of monitored/save URLs and API credits left.
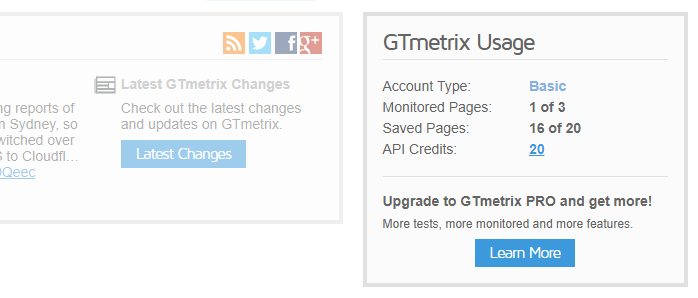
Your GTmetrix Usage details are located on the bottom right section.
Of course, you can upgrade to PRO if you’ve reached the limits of your Basic account and need more.
Keep your site’s performance at the top of mind
PRO Monitoring Splash
Get more monitoring slots and advanced options along with hourly testing with a GTmetrix PRO plan.
Available in Bronze, Silver or Gold levels – or create a Custom plan to suit your needs!
Other features include: Priority access in the queue, the Developer Toolkit bundle, Remote location monitoring, and much more!
Upgrade to PRO today!
ما را در سایت GTmetrix دنبال می کنید
برچسب : نویسنده : وستا gtmetrixs بازدید : 216